National Weather Service Post Wildfire Debris Flow and Flash Flood Web Page
IF YOU LIVE NEAR OR ARE VISITING THE AREA OF one of the Central Washington wildfires listed below, you can load up this page to see the most recently reported rainfall accumulation:
1.usa.gov/1ljxvwG
This is an interactive map, and you can adjust the settings on the page to view specific data and displays in the “Overlays” menu at the left of the map. For different displays of rainfall accumulation periods, click on the arrow just to the right of “Surface Weather Observations” and then click the “Duration” box to choose a time period.
In the “Display” selection you can see other data (such as temperature and wind speed) reported by in-the-field weather stations. To view all available weather station reports, make sure that “Density” and “Provider” on the menu are both set to “All.”
Current National Weather Service (NWS) hazards and warnings can be overlayed onto the map by clicking the “NWS Hazards & Warnings” box.
To choose which wildfire details you see (and/or turn off the Fire Name labels), scroll down to the bottom of the “Overlays” menu and expand the “Fire Perimeter Information” selection. In “Display” you can edit which year’s details you want to see. To show fire names on the map, uncheck the “Perimeter Only” box.
You can then bookmark any custom map you create by clicking the “Permalink” button above the map — and then bookmarking that link when the page is refreshed.
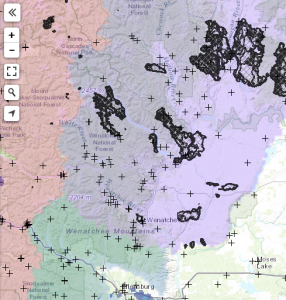
The Washington State Department of Ecology has recently installed several more rapid-reporting rain gauges and stream gauges in and near the 2015 burn areas to help with flash flood warnings in areas where radar coverage is less than ideal and where life and property are at risk downstream. Listed below are links to NWS web maps that show available rain gauge data near the fire perimeters — data from NWS, RAWS, Dept. of Ecology, USGS, SNOTELs, etc. These links show the fire perimeter and the latest hourly total of rainfall for all available gauges in the area, along with radar data and other details.
- 2015 Wolverine, First Creek, Black Canyon, Chelan Complex Fires:
go.usa.gov/cDYkF - 2015 Okanogan Complex, Tunk Block, North Star, Lime Belt, Twisp Fires:
go.usa.gov/cDYZQ
- 2015 Stickpin, Renner, Graves, Twenty-One Mile, Carpenter Rd, Tower Fires:
go.usa.gov/cDYnY - 2014 Carlton Complex:
go.usa.gov/cDCTz - 2014 Mills Canyon, Duncan, Chiwaukum Fires:
go.usa.gov/cDggH
You can change the data display on each map using the table on the left of the map. Use our CONTACT page if you have any questions about changing what the map shows or sources of the data on the map, or if you want help to set up a different bookmark link with other fire perimeters, longer precipitation timeframes, or other details.
Do note that most of these gauges are not winterized, so if snow melts in the gauge, it will report as if it were raining; such gauges can sometimes send inaccurate data in colder temperatures — the primary use for many of these gauges is during thunderstorm season. Also, the amount reported on the map for the duration selected (for example 1-hour accumulation) is for the hour previous to when that gauge last reported. To find the precise timing of the rainfall and when the gauge reported, you can click on a gauge on the map and scroll down below the map for the table of data.
Washington Department of Ecology rain and stream gauges can be viewed on their website: https://fortress.wa.gov/ecy/eap/flows/regions/state.asp
USGS rain gauges placed in Chelan County after the 2012 Wenatchee Complex fires can be viewed on their website:
http://waterdata.usgs.gov/wa/nwis/current/?type=precip&group_key=county_cd
OTHER USEFUL WEATHER LINKS:
- National Weather Service Spokane homepage (official location for forecasts, watches and warnings)
- Weekly weather briefing posted on YouTube every Monday afternoon
- NWS Spokane Twitter
- NWS Spokane Facebook
(Thanks very much to Katherine Rowden, NWS Service Hydrologist, for the information and resources listed on this page.)